> For the complete documentation index, see [llms.txt](https://docs.seemoredata.io/external-docs/llms.txt). Markdown versions of documentation pages are available by appending `.md` to page URLs; this page is available as [Markdown](https://docs.seemoredata.io/external-docs/fundamentals/our-features/real-time-monitoring.md).
# Real Time Monitoring
A live, fleet-wide view of every warehouse — current state, running and queued queries, automation coverage, and on-demand query inspection.
## Overview
**Real Time Monitoring** is the live operations view for your entire warehouse fleet. Instead of drilling into one warehouse at a time, you get a single glanceable page that answers *"what is running, queued, scaling, or stuck **right now**?"* across every connected Snowflake account.
Find it in the navigation under **Monitoring → Real Time**.
The screen has three tabs:
| Tab | What it shows |
| --------------------- | ------------------------------------------------------------------------------------------------------------------------------------------------------------- |
| **Compute units** | A live tile per warehouse — state, running/queued queries, automation status. |
| **Real-time queries** | The actual queries running in a chosen account over the last few minutes. |
| **Alerts** | Rules that notify you when a warehouse misbehaves. See [Real Time Alerts](/external-docs/fundamentals/our-features/real-time-monitoring/real-time-alerts.md). |
{% hint style="info" %}
Auto-refresh only runs on the **Compute units** tab. When you switch to **Real-time queries** or **Alerts**, polling pauses so the page stays quiet while you read.
{% endhint %}
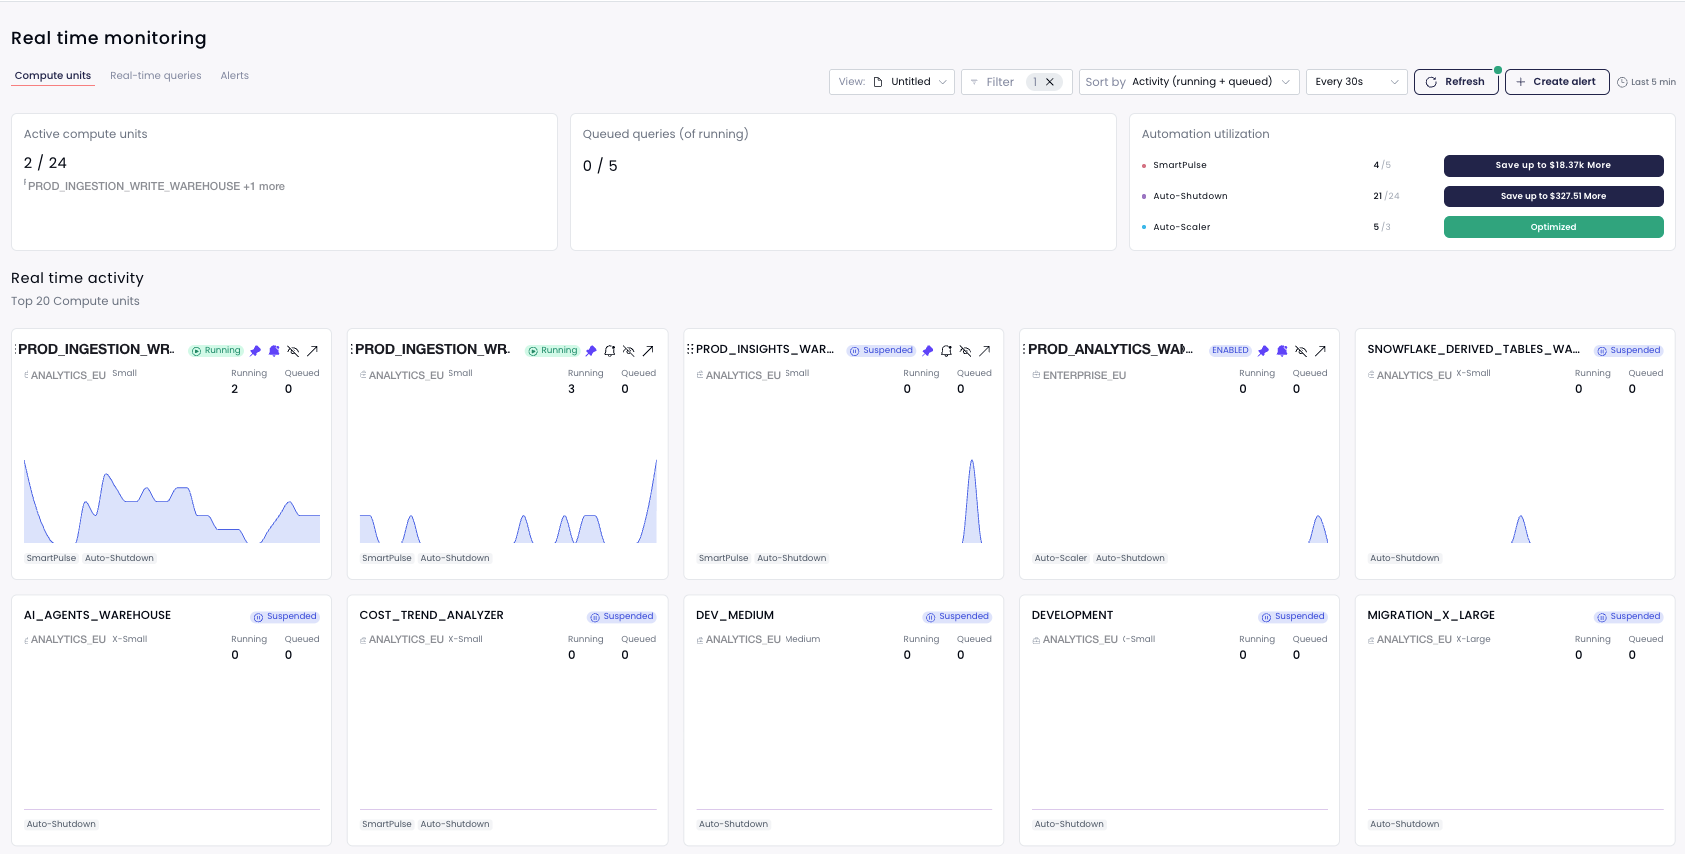
Real Time Monitoring — Compute units tab with the fleet rollup and live warehouse tiles
***
## Compute units tab
This is the default view: a live grid of warehouse tiles with a fleet-wide rollup on top.
### Fleet rollup
Six counters summarize the whole fleet at a glance:
| Counter | Meaning |
| -------------------- | -------------------------------------------------------------------------------------------------------------- |
| **Warehouses up** | Warehouses currently running. |
| **Running queries** | Total queries executing across the fleet. |
| **Queued queries** | Total queries waiting for capacity. |
| **Smart Pulse on** | Warehouses with [Smart Pulse](/external-docs/fundamentals/our-features/automations/smart-pulse.md) active. |
| **Auto Scaler on** | Warehouses with [Auto Scaler](/external-docs/fundamentals/our-features/automations/auto-scaler.md) active. |
| **Auto Shutdown on** | Warehouses with [Auto Shutdown](/external-docs/fundamentals/our-features/automations/auto-shutdown.md) active. |
The first three are live activity numbers; the last three are adoption counters that tell you how much of the fleet each automation covers.
### Warehouse tiles
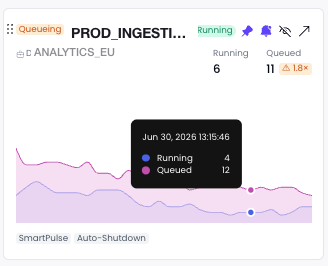
Each warehouse appears as a card. Click anywhere on a tile to jump into that warehouse's **Real time** tab on its details page.
A single warehouse tile
A tile shows:
* **State chip** — `Running`, `Suspended`, `Resuming`, or `Resizing`.
* **Name, account, and size** — including the started cluster count for multi-cluster warehouses.
* **Running / queued counts** — the live query load, with a visual cue when a warehouse is queueing (more queued than running).
* **Sparkline** — running and queued query counts over the last few minutes (default window: **5 minutes**), so you can see trends, not just the current instant.
* **Automation chips** — Smart Pulse, Auto Scaler, and Auto Shutdown light up green when active and stay grey when off.
* **Firing indicator** — if a [Real Time Alert](/external-docs/fundamentals/our-features/real-time-monitoring/real-time-alerts.md) is currently firing for the warehouse, the tile is highlighted and shows a firing badge. Hover it to see which rule fired and its severity.
Hover (or focus) a tile to reveal its actions:
| Action | What it does |
| ---------------- | -------------------------------------------------------------------------------------------------------------------------------------------------------------------------------------------- |
| **Pin** | Keeps the warehouse at the top of the grid regardless of sort. |
| **Hide** | Removes the tile from the grid. Restore it later with **Restore removed**. |
| **Open** | Opens the warehouse's full **Real time** details page. |
| **Bell (alert)** | Creates a [Real Time Alert](/external-docs/fundamentals/our-features/real-time-monitoring/real-time-alerts.md) scoped to this warehouse — or edits the existing one if it's already covered. |
| **Drag handle** | Drag tiles to arrange them in a custom order. |
{% hint style="info" %}
Pinned, hidden, and custom-ordered tiles are remembered in your browser per account, so your layout survives a reload.
{% endhint %}
### Toolbar
| Control | Options |
| ----------------------- | ----------------------------------------------------------------------------------------------------------------------------------------------------------- |
| **Sort by** | Activity (running + queued) — default · Running (high → low) · Queued (high → low) · Name (A → Z) · Custom order. |
| **Refresh** | Off · Every 5s · Every 10s · Every 30s (default) · Every 60s. |
| **Refresh button** | Triggers an immediate refresh. The dot next to it is **green** while auto-refresh is on (and pulses on every successful update) and **grey** when it's off. |
| **Restore removed (n)** | Appears only when you've hidden tiles; brings them all back. |
| **Create alert** | Opens the [Real Time Alert](/external-docs/fundamentals/our-features/real-time-monitoring/real-time-alerts.md) rule builder. |
| **Last N min** | Indicates the time window each tile's sparkline covers. |
### Filters and saved views
Use the **filter** button to narrow the fleet by:
* **Account** — one or more connected Snowflake accounts.
* **Compute units** — specific warehouses (available once a single account is selected).
* **Budget segment** and **Tags** — your own groupings.
* **Size**, **Resource constraint**, and **Automation status** (`Active` / `Disabled`).
You can save a filter combination as a **view** and switch between views from the toolbar. Views are shared with the Cost Overview compute-units page, so the same saved views (e.g. "EU prod fleet") apply in both places.
***
## Real-time queries tab
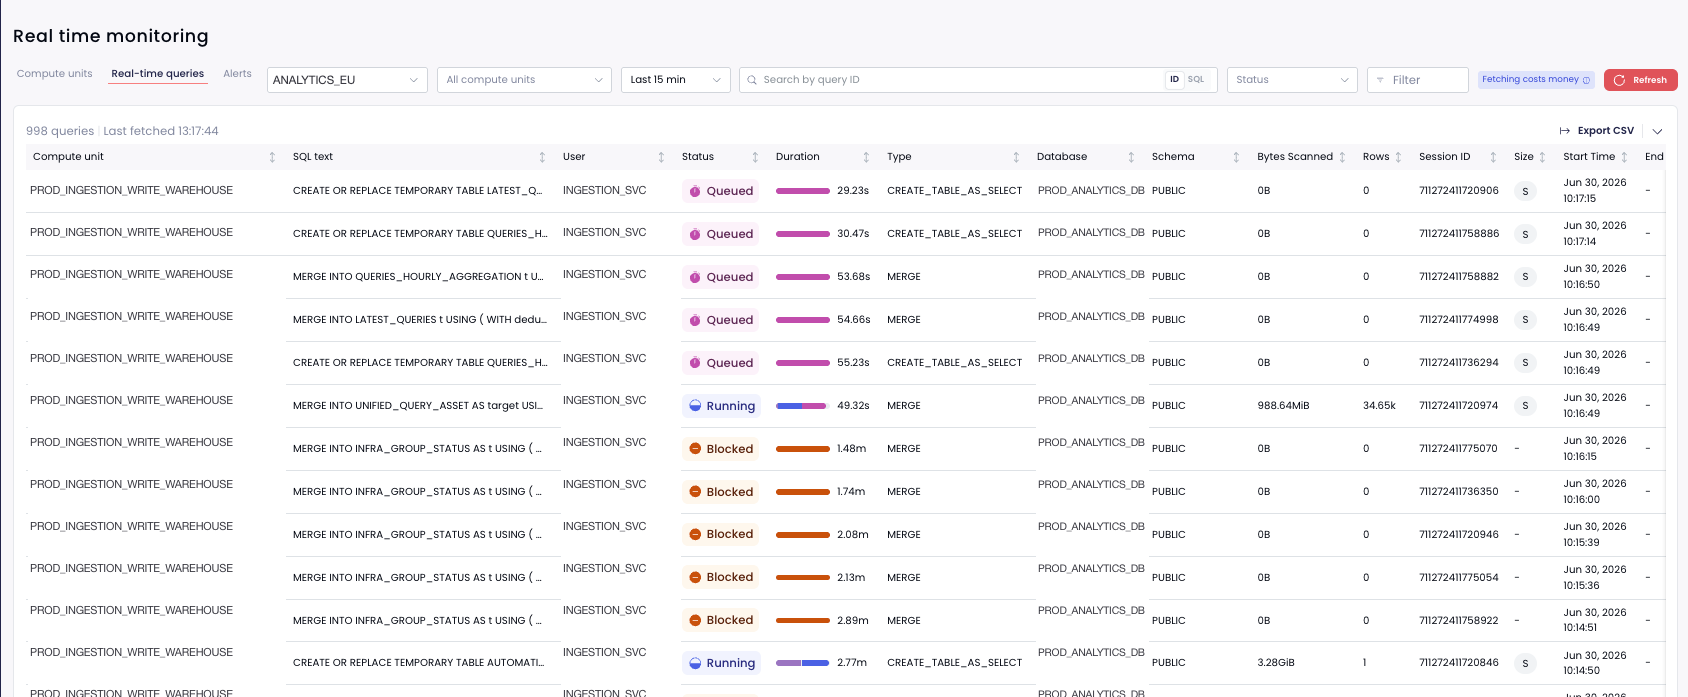
This tab lists the **actual queries** running on a chosen account over a short recent window, so you can see exactly what's driving the load you see on the Compute units tab.
Real-time queries for a selected account
{% hint style="warning" %}
**Fetching queries costs money.** Loading this tab runs a query against your Snowflake account (`INFORMATION_SCHEMA.QUERY_HISTORY`) and may incur compute cost **each time you fetch or refresh**. For that reason it does **not** auto-refresh — you fetch on demand.
{% endhint %}
To use it:
{% stepper %}
{% step %}
#### Pick an account
Select the Snowflake account (integration) you want to inspect. Optionally narrow to specific compute units, or leave it on **All compute units**.
{% endstep %}
{% step %}
#### Choose a time window
**Last 15 min** (default), **Last 30 min**, or **Last 60 min**.
{% endstep %}
{% step %}
#### Fetch
Click **Fetch Queries**. Once results load, the button becomes **Refresh** for an explicit re-fetch. The table header shows the result count and the time it was last fetched.
{% endstep %}
{% step %}
#### Filter and search
Search by SQL text or query ID, and use the quick filters (e.g. by status) or the filter drawer to focus on the queries that matter.
{% endstep %}
{% endstepper %}
***
## How the data stays current
* On the **Compute units** tab, Seemore polls for fresh warehouse state at the interval you choose in the toolbar. The live dot pulses on every successful update.
* The data comes from frequent point-in-time snapshots of your warehouses, so the counts and states reflect what Snowflake reported moments ago — not a once-a-day batch.
* The **Real-time queries** tab is the one exception: it fetches on demand because each fetch runs a billable query in your account (see the warning above).
***
## Related
{% content-ref url="/pages/q88Qif5MhR3Qirgt6Tuq" %}
[Real Time Alerts](/external-docs/fundamentals/our-features/real-time-monitoring/real-time-alerts.md)
{% endcontent-ref %}
* [Burst Protector](/external-docs/fundamentals/our-features/automations/smart-pulse/burst-protector.md) — automatically absorbs sudden query spikes detected in real time.
* [Live Tuning](/external-docs/fundamentals/our-features/automations/live-tuning.md) — temporarily override a warehouse's configuration from its **Real time** tab.