> For the complete documentation index, see [llms.txt](https://docs.seemoredata.io/external-docs/llms.txt). Markdown versions of documentation pages are available by appending `.md` to page URLs; this page is available as [Markdown](https://docs.seemoredata.io/external-docs/fundamentals/our-features/seemore-assistant.md).

# Seemore Assistant

Ask questions about your cost, compute, queries, and savings in plain language — from a full page or a sidebar that reads the page you're on. The Seemore Assistant answers with charts and tables, usin

## Overview

The **Seemore Assistant** is an AI assistant built into SeeMore Data. Ask a question in plain language, like *"Why did my compute cost go up this week?"*, and it pulls the relevant data from your account, analyzes it, and answers with a written explanation, charts, and tables.

It uses the same data you see across SeeMore Data: cost, warehouses (compute units), queries, anomalies, insights, budgets, contract, savings, and lineage. You get an answer in seconds instead of building filters and moving between pages.

You can use the assistant in two places:

|                  | **Sidebar assistant**                                                                               | **Full-page assistant**                                           |
| ---------------- | --------------------------------------------------------------------------------------------------- | ----------------------------------------------------------------- |
| **Where**        | A panel next to any page in SeeMore Data                                                            | Its own page, **Seemore Assistant** in the left navigation        |
| **Best for**     | Questions about what's on screen: *"Why is this query expensive?"*                                  | Broad questions about your whole account, and browsing past chats |
| **Page context** | Reads the page you're on. See [How the assistant reads the page](#how-the-assistant-reads-the-page) | None, it starts from your whole account                           |
| **Open with**    | The **Assistant** tab on the right edge, or **⌘ + .** / **Ctrl + .**                                | The **Seemore Assistant** navigation item                         |

Both use the same chats, so you can start a conversation in one and continue it in the other.

{% hint style="info" %}
**Required role to use:** [Viewer](/external-docs/fundamentals/settings/user-roles.md) or higher.

Every user can chat with the assistant. It only sees the data your own role and access grants allow. See [Security & Privacy](#security-and-privacy) below.
{% endhint %}

***

## The Sidebar Assistant

The sidebar assistant goes with you around SeeMore Data. It opens as a panel on the right side of the screen, next to the page you're working on, so you can ask about a warehouse, anomaly, or query without leaving it.

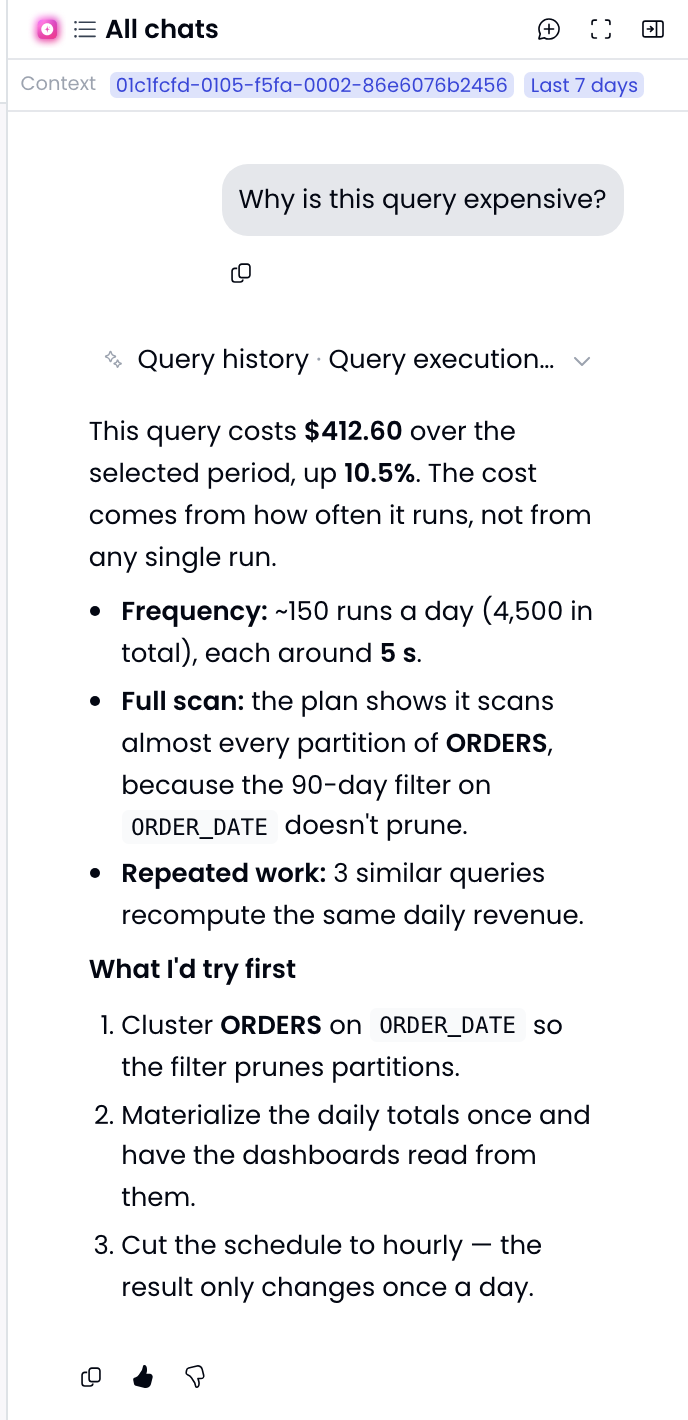
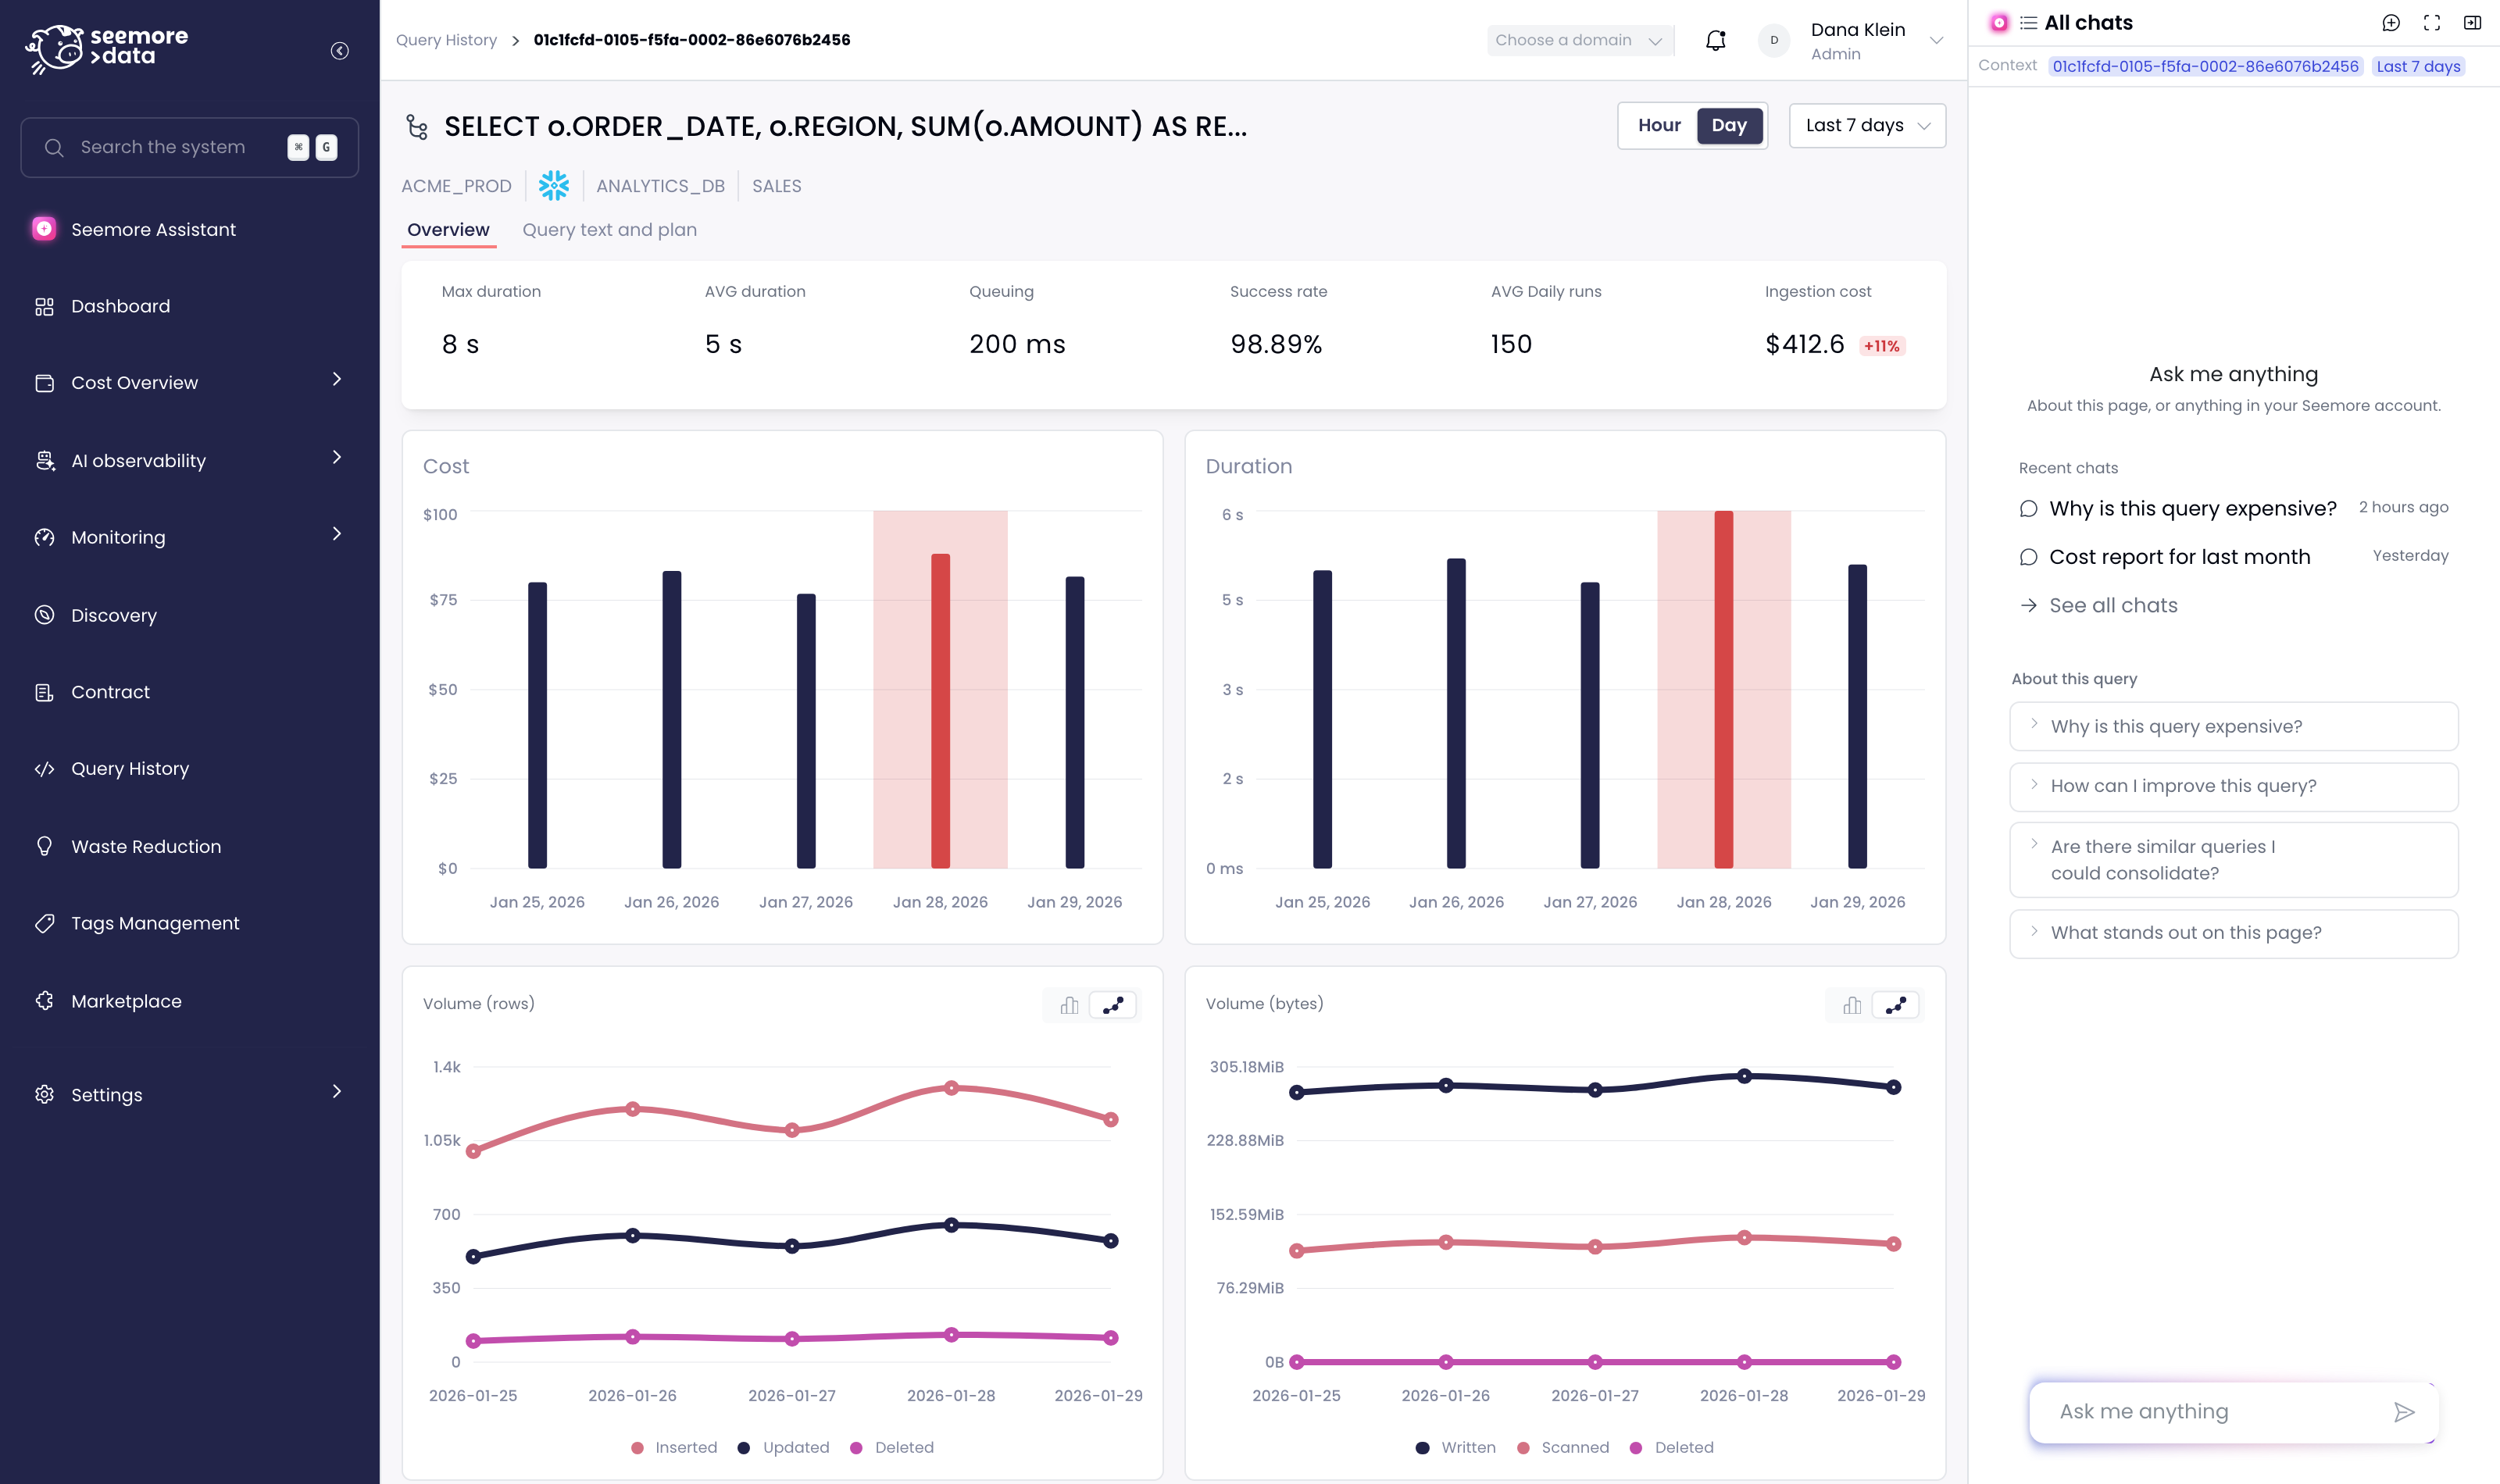
<figure><img src="https://3620459840-files.gitbook.io/~/files/v0/b/gitbook-x-prod.appspot.com/o/spaces%2FnSbIoBjUxWTGNWa9gGw7%2Fuploads%2Fgit-blob-7ce33ca25cb0d53714dd3105ae7a21b3b3bc7f81%2Fside-panel-on-query-page.png?alt=media" alt="A query page in SeeMore Data with the Seemore Assistant sidebar open on the right, showing the Context bar and suggested questions about this query"><figcaption><p>The sidebar open on a query page. The <strong>Context</strong> bar shows which query and time range it's reading, and the suggestions are about this query.</p></figcaption></figure>

### Opening and closing the sidebar

* **Open it:** click the **Assistant** tab on the right edge of any page, or press **⌘ + .** (Mac) / **Ctrl + .** (Windows).
* **Close it:** click **Collapse** in the sidebar header, or press the same shortcut again.
* **Opens by itself:** the sidebar opens automatically on an [anomaly](/external-docs/fundamentals/our-features/monitoring-cost-management/anomalies-detection.md) detail page and on a [query](/external-docs/fundamentals/our-features/query-analyzer.md) page, because questions there are almost always about what's on screen.
* **Opens with a question:** select a time window on a warehouse's activity chart and click **Investigate with Seemore**. The sidebar opens and asks *"What happened in this window?"* for you. See [Example: investigate a time window](#example-investigate-a-time-window).

Your browser remembers whether the sidebar was open, so it stays the way you left it.

### Sidebar controls

| Control                          | What it does                                                           |
| -------------------------------- | ---------------------------------------------------------------------- |
| **All chats** / **Back to chat** | Switch between the current chat and the list of your past chats        |
| **New chat**                     | Start a fresh conversation                                             |
| **Open in full screen**          | Move the current chat to the full-page assistant and continue it there |
| **Collapse**                     | Close the sidebar. Your chat is kept.                                  |
| **Resize**                       | Drag the sidebar's left edge to make it wider or narrower              |

### It stays with you as you navigate

The chat stays open as you move between pages. Every message you send includes the page you're on **at that moment**, so you can move from one page to the next and keep asking in the same chat:

1. On a compute unit page, ask *"Why is this compute unit expensive?"*
2. Click through to one of its expensive queries.
3. In the same chat, ask *"And how can I improve this query?"* The assistant now answers about the query on screen, with the previous answer still in the conversation.

Reloading the browser opens the sidebar on a new chat. Your earlier chats are saved under **All chats**.

***

## How the Assistant Reads the Page

When you ask a question from the sidebar, the assistant receives a short description of the page you're on: which page it is, which item it shows, and how the view is set. That's why you can say *"this"*, *"here"*, or *"it"* instead of copying IDs, names, and dates into your question.

### The Context bar

The **Context** bar under the sidebar header shows what the assistant is reading:

* **Page**: the page or item on screen, such as a query ID, a compute unit, or an anomaly.
* **Time range**: the range selected on the page, such as **Last 7 days** or a custom date range.
* **Zoomed window** (only when you've selected one): a highlighted chip with the exact start and end times you selected on a chart. Click its **×** to remove it, and the assistant goes back to the page's time range.

<figure><img src="https://3620459840-files.gitbook.io/~/files/v0/b/gitbook-x-prod.appspot.com/o/spaces%2FnSbIoBjUxWTGNWa9gGw7%2Fuploads%2Fgit-blob-5d84f722642542cf0a0924319e656d732990a500%2Fside-panel-context-answer.png?alt=media" alt="Seemore Assistant sidebar answering Why is this query expensive? for the query shown in the Context bar" width="344"><figcaption><p>"Why is this query expensive?" is answered about the query in the Context bar. The assistant looked up that query's history, execution plan, and similar queries without being given an ID.</p></figcaption></figure>

### What the assistant picks up

| Context                    | Examples                                                                                                                                     | How it's used                                                                                         |
| -------------------------- | -------------------------------------------------------------------------------------------------------------------------------------------- | ----------------------------------------------------------------------------------------------------- |
| **The page**               | Compute unit details, Anomaly, Query, Contract, Budget, Workloads                                                                            | Understands what *"this page"* means                                                                  |
| **The item on screen**     | The compute unit, account, anomaly, query, budget, insight, recommendation, asset, or user the page is about                                 | *"this"*, *"here"*, and *"it"* refer to that item                                                     |
| **The page tab**           | The **Real time** tab of a compute unit, or a tab in Workloads                                                                               | Answers about the part of the page you're looking at                                                  |
| **Time range**             | **Last 7 days**, **Last 30 days**, or a custom range                                                                                         | Used as the default period for the answer                                                             |
| **Zoomed window**          | A time window you selected on a chart                                                                                                        | Takes priority over the page's time range                                                             |
| **Domain filter**          | The domains selected at the top of the page                                                                                                  | Keeps the answer to those domains                                                                     |
| **How the view is set up** | Workloads grouped by a query tag, the tag keys you filtered on, the contract and years shown, lineage depth, the number of accounts selected | Answers about **this view**, not your whole account                                                   |
| **Data platform**          | Snowflake or Databricks                                                                                                                      | Uses the right terms. On Databricks, compute units are SQL warehouses, clusters, jobs, and pipelines. |

{% hint style="info" %}
**The page's context is a starting point, not a limit.** Ask about something else, like *"What about last quarter?"* or *"Compare this to ANALYTICS\_WH"*, and the assistant answers that instead. Any period you name in your question overrides the page's time range.
{% endhint %}

### What it doesn't pick up

The page context is a short, fixed list of identifiers and view settings. The assistant does **not** read the data displayed on your screen. It doesn't receive filter values, tag values, or any other part of the page address. When it needs numbers, it looks them up itself, **with your permissions**. See [Security & Privacy](#security-and-privacy).

***

## Page Context Examples

Each page offers its own suggested questions in the sidebar. Here's what the assistant knows on each page and the kinds of questions it handles well.

### Compute unit (warehouse) page

**It knows:** which compute unit you're viewing, the tab you're on, and the selected time range.

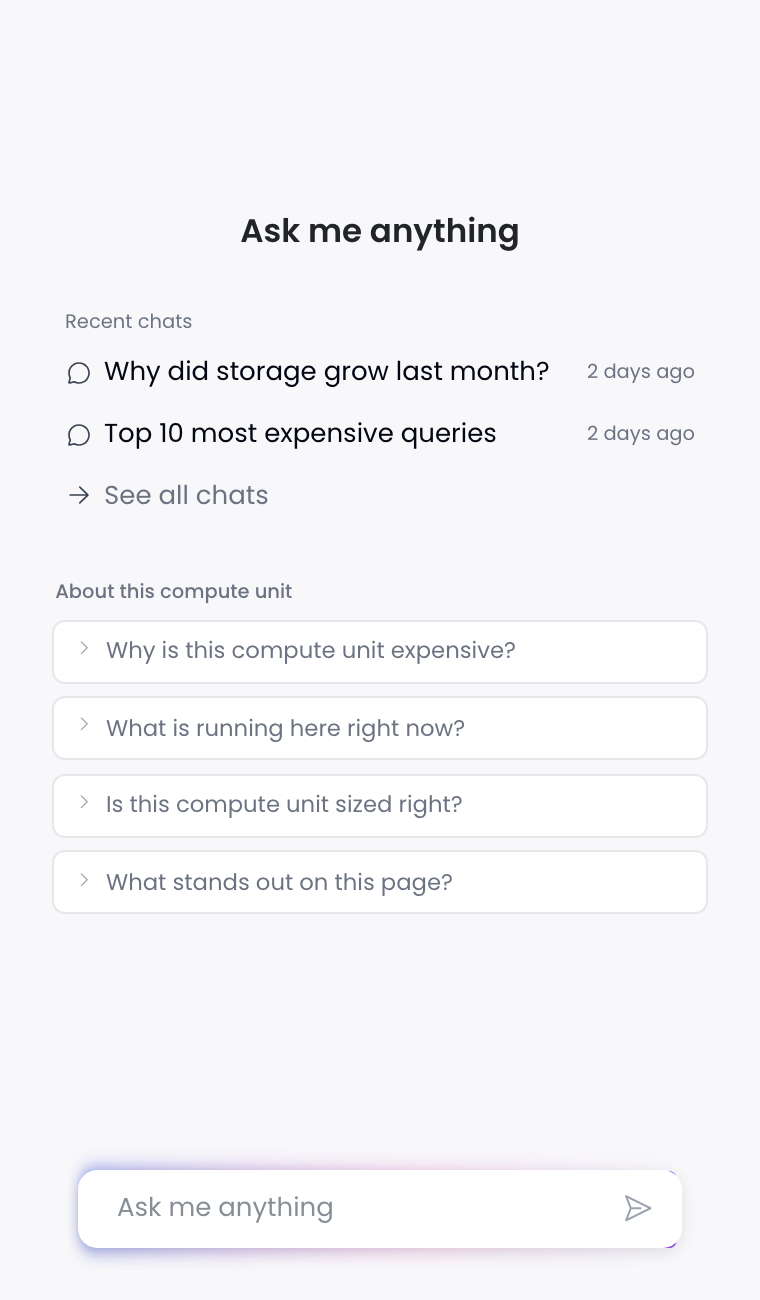
* *"Why is this compute unit expensive?"*: breaks down its cost over the period and points to the workloads and queries that drive it.
* *"What is running here right now?"*: checks live status and the queries currently running or queued on it.
* *"Is this compute unit sized right?"*: compares its size and activity with the queuing and idle time it shows.
* *"What did Smart Pulse change here this week?"*: lists recent [automation](/external-docs/fundamentals/our-features/automations.md) changes on this compute unit and their impact.

<figure><img src="https://3620459840-files.gitbook.io/~/files/v0/b/gitbook-x-prod.appspot.com/o/spaces%2FnSbIoBjUxWTGNWa9gGw7%2Fuploads%2Fgit-blob-7183992d09e09c1989f6f77a04e850d8dbd2b9f3%2Fassistant-side-panel.png?alt=media" alt="Seemore Assistant sidebar on a compute unit page with suggestions: Why is this compute unit expensive, What is running here right now, Is this compute unit sized right" width="380"><figcaption><p>Suggested questions on a compute unit page</p></figcaption></figure>

### Example: investigate a time window

On a compute unit's activity chart, drag across the spike you want to understand and click **Investigate with Seemore**. The sidebar opens, a **zoomed window** chip appears in the Context bar with the exact times you selected, and the assistant is asked *"What happened in this window?"*.

The assistant limits its answer to those minutes, not the whole day. For example, it can tell you which queries were running, whether queries were queuing, and whether the warehouse scaled up or out. Follow up with *"Which user ran the most expensive of those?"* and it keeps using the same window. Click **×** on the chip to go back to the page's full time range.

### Anomaly page

**It knows:** which [anomaly](/external-docs/fundamentals/our-features/monitoring-cost-management/anomalies-detection.md) you're viewing. It looks up the affected asset and its normal baseline itself.

* *"Explain this anomaly"*: describes what spiked, by how much, compared with the normal level, and the likely cause.
* *"What else changed at the same time?"*: looks for other cost changes, anomalies, or automation events in the same window.

### Query page

**It knows:** which query and query pattern you're viewing, and the selected time range.

* *"Why is this query expensive?"*: combines the query's run history, execution plan, and similar runs to explain where the cost comes from.
* *"How can I improve this query?"*: suggests concrete changes based on the execution plan, like better partition pruning or clustering.
* *"Are there similar queries I could consolidate?"*: finds other queries doing the same work.

### Workloads

**It knows:** how the view is grouped, for example by a query tag, which tab you're on, and which [query tag](/external-docs/fundamentals/our-features/observability/query-tags.md) keys you've filtered on.

* *"What is driving cost in this view?"*: answers about the workloads as you've grouped and filtered them, not about your whole account.
* *"Which workloads grew the most this week?"*
* *"Which dbt models cost the most?"* and *"Which dbt models got slower this week?"*: suggested when dbt is connected.

### Contract

**It knows:** which [contract](/external-docs/fundamentals/our-features/observability/contract-view.md) is selected, the years shown, the forecast setting, and whether you've filtered to specific accounts.

* *"Are we on track with the contract?"*
* *"When do we run out of credits?"*
* *"How big should the next contract be?"*

### Budget

**It knows:** which [budget](/external-docs/fundamentals/our-features/monitoring-cost-management/budget-groups.md) you're drilling into.

* *"Will this budget breach, and when?"*
* *"What is driving spend in this budget?"*

### Asset page (Discovery)

**It knows:** which table or asset you're viewing and how many lineage hops upstream and downstream are shown.

* *"Who reads from this, and what does it cost them?"*
* *"What breaks if this asset changes?"*

These lineage questions are suggested when the asset has lineage.

### Any other page

On every page, you can ask *"What stands out on this page?"*. The assistant uses the page and its time range to give a quick summary of what's worth your attention. On pages that aren't about one item, the sidebar suggests general questions about your account.

***

## The Full-Page Assistant

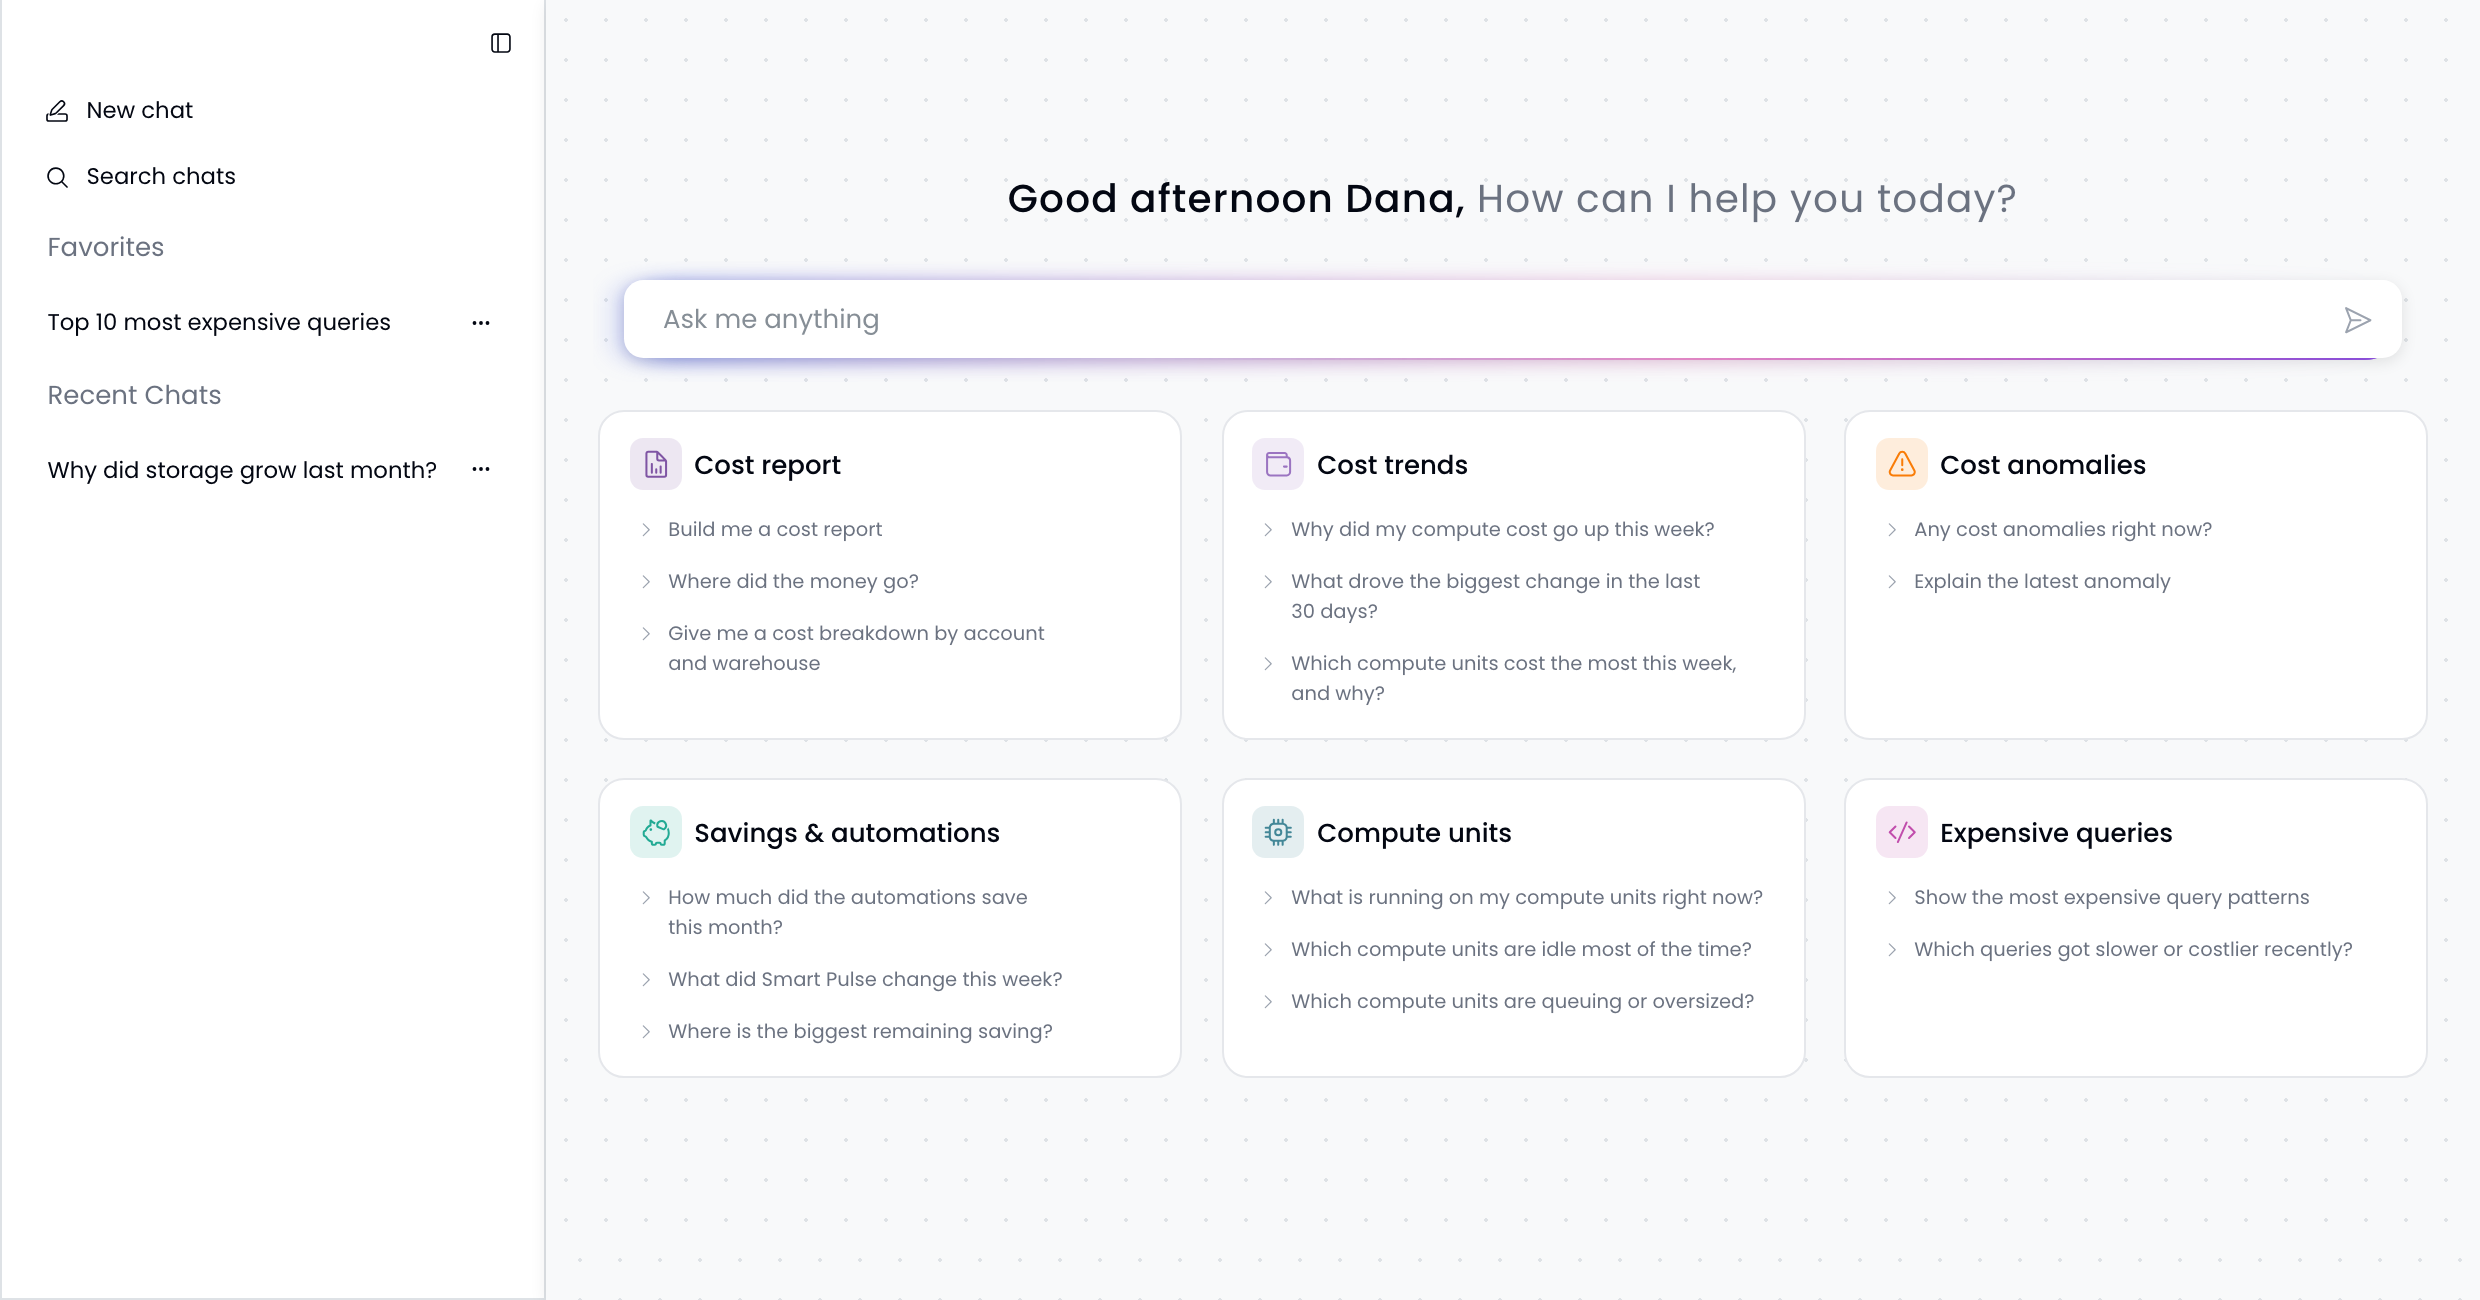
Click **Seemore Assistant** at the top of the left navigation to open the assistant on its own page. It starts from your whole account rather than a specific page, and shows topics to start from: cost reports, cost trends, cost anomalies, savings and automations, compute units, and expensive queries. The sidebar on the left lists all your chats.

<figure><img src="https://3620459840-files.gitbook.io/~/files/v0/b/gitbook-x-prod.appspot.com/o/spaces%2FnSbIoBjUxWTGNWa9gGw7%2Fuploads%2Fgit-blob-29c69db3fd87330fb7532229f8538796ab52032d%2Fassistant-home.png?alt=media" alt="Seemore Assistant full page with a greeting, a message box, and suggested questions grouped by topic"><figcaption><p>The full-page assistant, with suggested questions grouped by topic and your chats on the left</p></figcaption></figure>

***

## What You Can Ask

The assistant can answer questions in the following areas, from either the sidebar or the full page:

| Area                      | Example questions                                                                                                                     |
| ------------------------- | ------------------------------------------------------------------------------------------------------------------------------------- |
| **Cost reports**          | "Build me a cost report", "Give me a cost breakdown by account and warehouse"                                                         |
| **Cost trends**           | "Why did my compute cost go up this week?", "What drove the biggest change in the last 30 days?"                                      |
| **Anomalies & insights**  | "Any cost anomalies right now?", "Explain the latest anomaly"                                                                         |
| **Savings & automations** | "How much did the automations save this month?", "What did Smart Pulse change this week?", "Where is the biggest remaining saving?"   |
| **Compute units**         | "What is running on my compute units right now?", "Which compute units are idle most of the time?", "Which are queuing or oversized?" |
| **Queries**               | "Show the most expensive query patterns", "Which queries got slower or costlier recently?"                                            |
| **Storage & services**    | "Where did storage grow?", "How much are we spending on AI services?"                                                                 |
| **Budgets & contract**    | "Are we on track against our budget?", "How much of our contract have we used?"                                                       |
| **Assets & lineage**      | "What feeds this table?", "Who uses this table downstream?"                                                                           |
| **Tags & attribution**    | "Cost by team, last 90 days", "Which query tags drive the most spend?"                                                                |
| **Product help**          | "How does Auto Shutdown work?". The assistant can read the SeeMore Data documentation.                                                |

### Answers with charts and tables

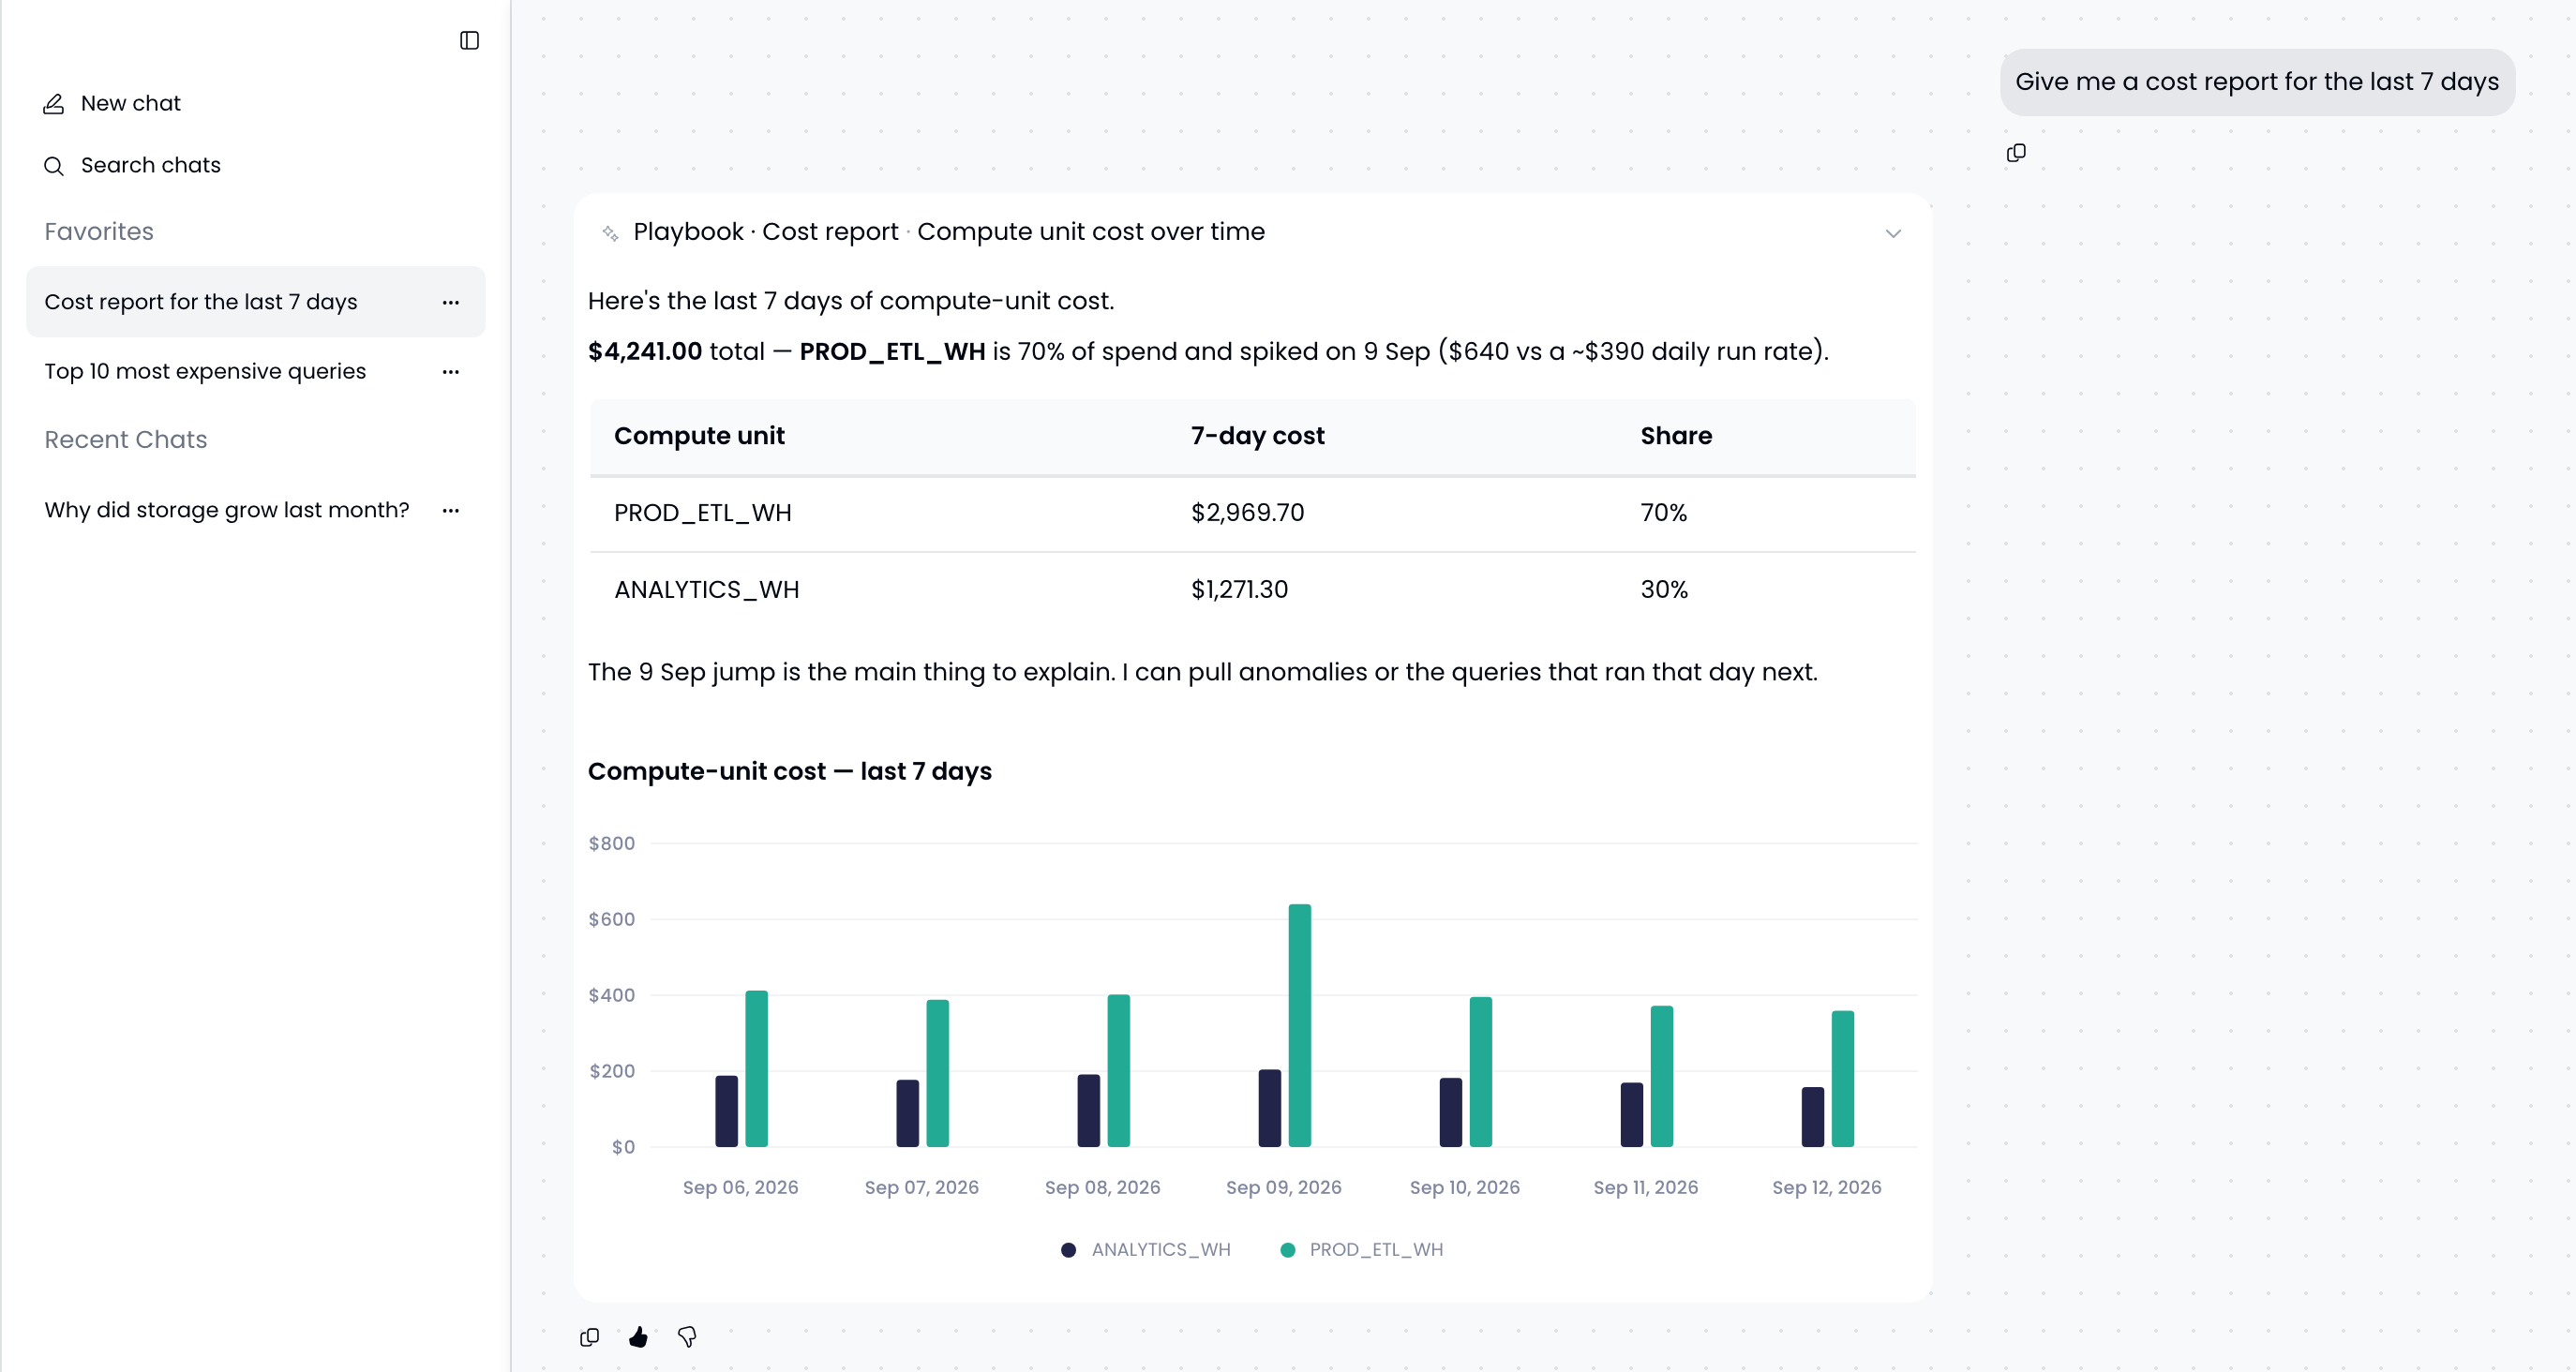
The assistant writes a short summary and adds charts and tables when they help. While it works, it shows each step it takes, such as *Cost report* or *Compute unit cost over time*. Expand a step to see where the numbers came from. Answers include links to the relevant pages in SeeMore Data so you can dig deeper.

For broad requests like *"Build me a cost report"*, the assistant follows a structured analysis and may first ask which period you want covered.

<figure><img src="https://3620459840-files.gitbook.io/~/files/v0/b/gitbook-x-prod.appspot.com/o/spaces%2FnSbIoBjUxWTGNWa9gGw7%2Fuploads%2Fgit-blob-83dcd1f78b3645c516213e123ff5385178b7ed90%2Fassistant-cost-report.png?alt=media" alt="Seemore Assistant answering a cost report request with a summary, a table, and a bar chart of daily compute cost"><figcaption><p>A cost report with a written summary, a breakdown table, and a daily cost chart</p></figcaption></figure>

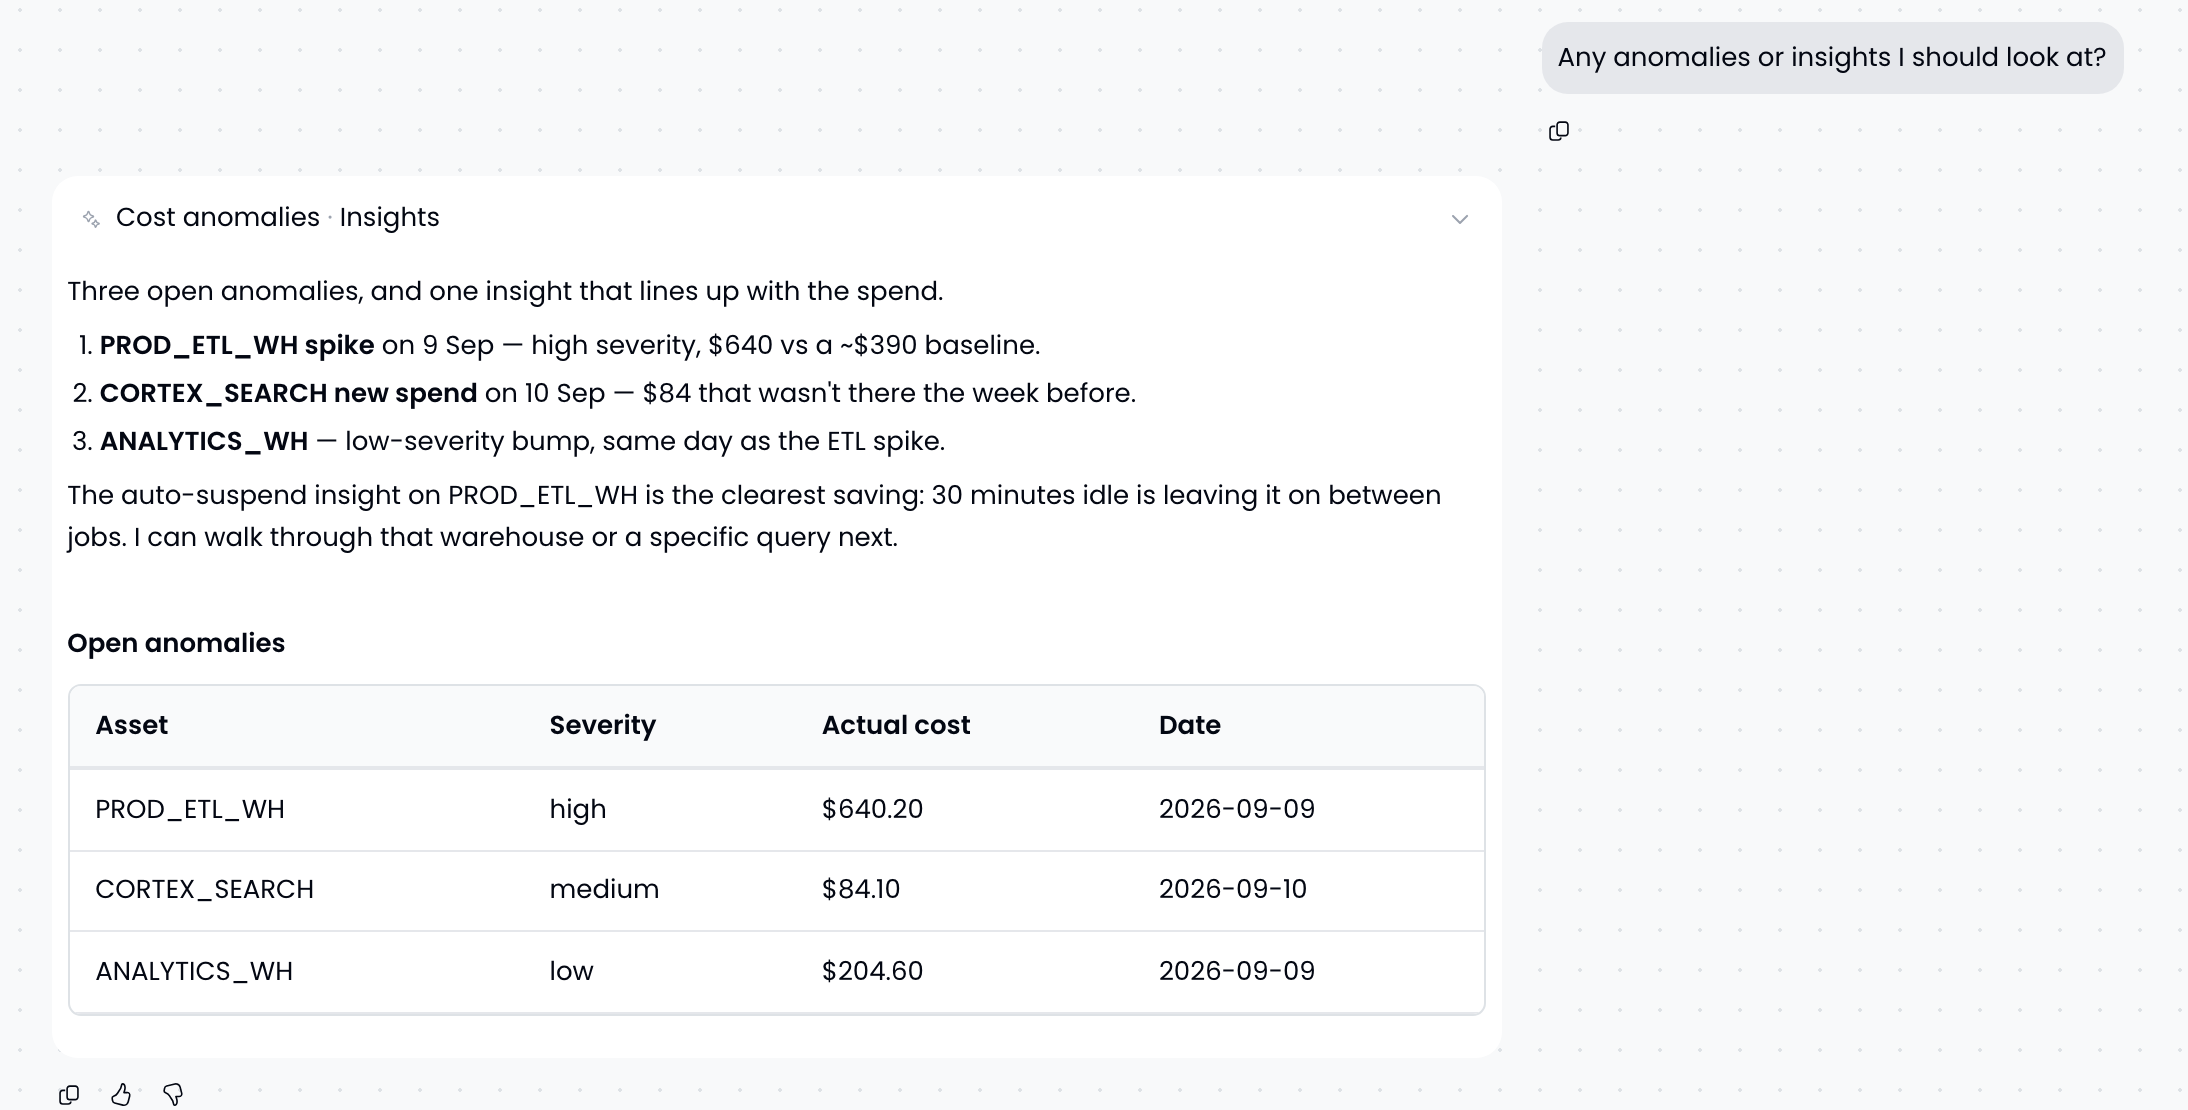
<figure><img src="https://3620459840-files.gitbook.io/~/files/v0/b/gitbook-x-prod.appspot.com/o/spaces%2FnSbIoBjUxWTGNWa9gGw7%2Fuploads%2Fgit-blob-8eea621da99ec6d21fc01dc026f01f3895c251fc%2Fassistant-anomalies.png?alt=media" alt="Seemore Assistant listing open cost anomalies with severity, cost, and date"><figcaption><p>Follow-up questions build on the conversation. Here the assistant lists open anomalies and the insight behind the spike.</p></figcaption></figure>

### Conversations

* **Chat history:** every conversation is saved as a chat. Find past chats under **All chats** in the sidebar or in the full-page list, search them, rename them, mark favorites, or delete the ones you no longer need.
* **Follow-ups:** ask follow-up questions in the same chat. The assistant remembers the whole conversation.
* **Keeps working in the background:** if you close the tab while an answer is being written, the answer keeps going and is waiting in the chat when you come back.
* **Feedback:** use the thumbs up and thumbs down buttons under each answer to tell us how it did. Use the copy button to copy an answer.
* **Stop generating:** stop a long answer at any time.

{% hint style="info" %}
Very long chats eventually fill up. If you see *"This conversation is full"*, click **New chat** to continue.
{% endhint %}

***

## The Assistant Is Read-Only

The assistant **reads** your data. It **does not change** anything in SeeMore Data or in your data platform. It cannot resize warehouses, enable automations, edit budgets, change settings, or run queries against your data. When you ask for a change, it explains what to do and links you to the page where you can make it yourself.

***

## Security and Privacy

The Seemore Assistant follows the same security model as the rest of SeeMore Data. For the full picture, see [Security Model & Architecture](/external-docs/security/security/model.md).

### Your data is never used to train AI models

Your questions, your chats, and your account's data are **never used to train AI models**. This applies to SeeMore Data and to our AI model provider. The model provider processes each request only to generate the answer, under enterprise terms that prohibit using customer data for training.

### It follows your role and access (RBAC)

The assistant never sees more than you do. Every question is answered **with your own permissions**, through the same role-based access control (RBAC) that applies everywhere else in SeeMore Data:

* **Your data scope applies.** The assistant only sees the accounts and assets granted to you through [Asset Groups](/external-docs/fundamentals/settings/access-control/asset-groups.md), either directly or through your [Teams](/external-docs/fundamentals/settings/access-control/teams.md). If a warehouse or account is outside your scope, the assistant can't see it either.
* **Your role applies.** Data that requires a higher [user role](/external-docs/fundamentals/settings/user-roles.md) stays hidden from the assistant too. For example, a Viewer can't use the assistant to read contract data that requires the Editor role.
* **Page context grants nothing.** The page context only tells the assistant *what* you're looking at. Every lookup is still checked against your permissions.
* **Your chats are private.** Other users, including admins, can't see your chats.
* **Every request is audited.** Each piece of data the assistant looks up is recorded for auditing, the same as any other request in SeeMore Data.

### It only uses metadata

The assistant works on the same **metadata** that SeeMore Data already collects, such as query history, warehouse usage, and cost. Like the rest of SeeMore Data, it has **no access to the contents of your tables**. Your data is encrypted in transit and at rest.

{% hint style="success" %}
SeeMore Data is **SOC 2 Type II** compliant. For more details, visit the [SeeMore Data Trust Center](https://seemoredata.io/trust/) or contact <security@seemoredata.io>.
{% endhint %}

***

## Tips for Better Answers

* **Ask from the right page.** Open the sidebar on the compute unit, anomaly, query, or budget you care about, and the assistant starts with it already in context.
* **Zoom in before you ask.** For a spike, select the window on the chart and use **Investigate with Seemore**. A narrow window gets a sharper answer than a whole day.
* **Be specific about time** when you're not using the page's range: *"last 7 days"*, *"this month"*, or *"since 1 September"*.
* **Name what you care about.** Mention the warehouse, account, team, or query ID when you're asking about something that isn't on screen.
* **Keep going.** Ask *"why?"*, *"break it down by user"*, or *"show it as a chart"* to go deeper in the same chat.